![]()
Undeveloped Land For Sale
State Route 386- Gallatin- TN 37066

Property Description
AVAILABLE SPACE
- Multiple retail sites available for development
PROPERTY INFORMATION
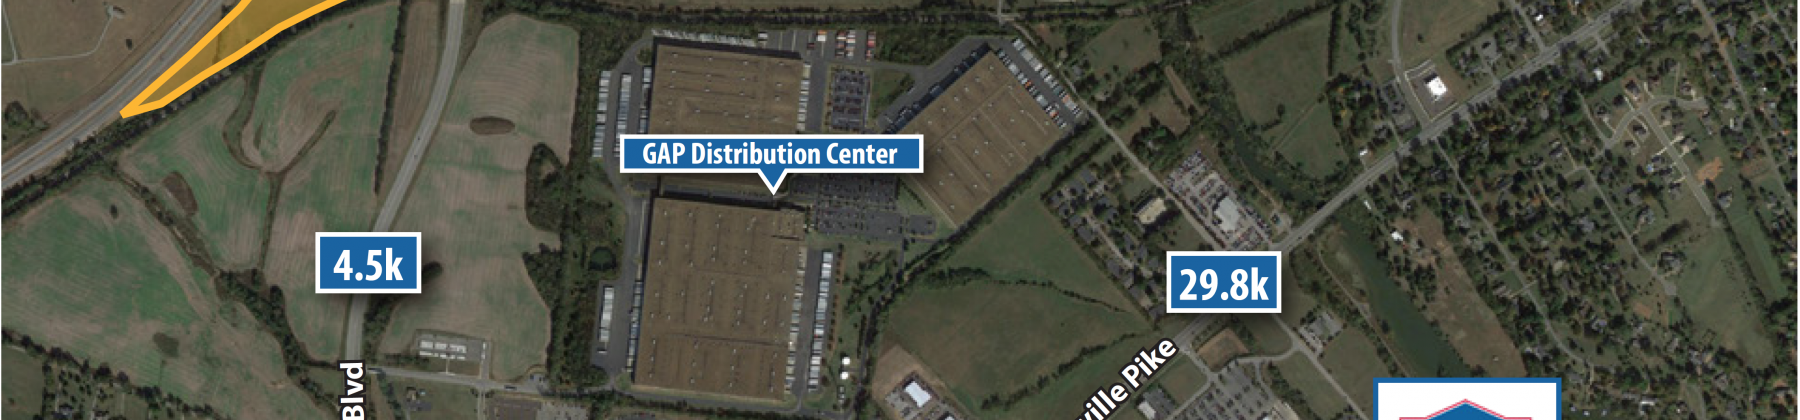
- Available sites in planned commercial development located along highly trafficked State Route 386
- Close proximity to national retailers including Walmart Supercenter, Belk, and Chick-fil-a and other planned commercial developments
- Construction planned to start late 2017
Basic Details
Property Title : Undeveloped Land For Sale
Property Page Title : Undeveloped Land For Sale - Price $0
Property Type : Undeveloped Land
Listing Type : For Sale
Price : Call for Pricing
Address Map
Country : US
State : TN
City : Gallatin
Zipcode : 37066
Street : State Route 386
Postal Code : 37066
Longitude : W87° 32' 51.6''
Latitude : N36° 23' 13.9''
Neighborhood
Shopping Center 5 Minutes
University 5 Minutes
Community Details
Traffic Counts :
| Location | Count |
|---|---|
| Tennessee State Route 386 | 38,155 AADT |
| Nashville Pike | 29,786 AADT |
| Green Lea Boulevard | 4,545 AADT |
|
|
|
Demographic Info :
| Category | 1 Mile | 3 Mile | 5 Mile | Retail Trade Area |
|---|---|---|---|---|
|
|
||||
| 2000 Census | 168 | 12,712 | 33,052 | 89,780 |
| 2010 Census | 258 | 18,219 | 41,824 | 113,341 |
| 2019 Estimate | 424 | 24,641 | 54,224 | 138,160 |
| 2024 Projection | 466 | 26,942 | 58,900 | 149,197 |
|
|
||||
| Average HouseHold Income | $81,698 | $95,062 | $92,085 | $84,685 |
| Median HouseHold Income | $59,820 | $71,570 | $67,132 | $64,455 |
| Per Capita Income | $38,922 | $37,974 | $36,223 | $32,307 |
|
|
||||
| Median Age | 37.29 | 40.53 | 39.64 | 39.94 |
| Average Age | 37.40 | 40.03 | 39.52 | 39.67 |
| 9 Years and Under | 12.26% | 12.70% | 12.99% | 12.79% |
| 10 - 17 Years | 10.38% | 10.82% | 11.06% | 10.99% |
| 18 - 24 Years | 7.55% | 7.96% | 8.30% | 8.40% |
| 25 - 34 Years | 15.80% | 11.27% | 11.63% | 11.52% |
| 35 - 44 Years | 17.45% | 13.30% | 13.23% | 13.03% |
| 45 - 54 Years | 13.44% | 13.19% | 13.27% | 13.57% |
| 55 - 64 Years | 11.56% | 13.74% | 12.89% | 13.10% |
| 65 Years and Older | 11.56% | 17.02% | 16.64% | 16.60% |
|
|
||||
| White Alone | 87.03% | 81.87% | 79.93% | 86.41% |
| Black or African American Alone | 7.78% | 11.95% | 12.21% | 7.54% |
| American Indian and Alaska Native Alone | 0.00% | 0.22% | 0.25% | 0.26% |
| Asian Alone | 1.42% | 1.36% | 1.38% | 1.14% |
| Native Hawaiian and other Pacific Islander Alone | 0.00% | 0.21% | 0.13% | 0.09% |
| Some Other Race Alone | 1.18% | 2.46% | 3.68% | 2.36% |
| Two or More Races | 2.59% | 1.92% | 2.42% | 2.20% |
| Hispanic or Latino of Any Race | 3.77% | 5.58% | 7.23% | 5.23% |
|
|
||||
| Graduate or Professional Degree | 13.9% | 11.3% | 10.5% | 8.2% |
| Bachelor's Degree | 22.4% | 22.1% | 20.9% | 16.8% |
| Associate Degree | 10.5% | 8.7% | 8.1% | 8.3% |
| Some College, No Degree | 16.9% | 22.8% | 23.0% | 22.0% |
| High School Graduate or GED | 30.8% | 26.8% | 27.0% | 32.8% |
| Some High School, No Deploma | 4.4% | 5.0% | 6.3% | 7.2% |
| Less than 9th Grade | 0.7% | 3.2% | 4.2% | 4.6% |
Undeveloped Land For Sale
- Visits : 232 in 1660 days
Call for Pricing
Contact Info

The Retail Coach
Tupelo


Walkscore
Contact